Tilda
AI · Fundamentals
Numbers before narratives.
Looks past the headline figures, into cash flow, filings and what the business actually earns.
Statements · Filings · Earnings calls
Price action, fundamentals, and technicals.
Every piece of research, connected.
Start with a company. Follow the connections.
Read financial reports without leaving your canvas.
Follow every angle. Keep the whole picture.
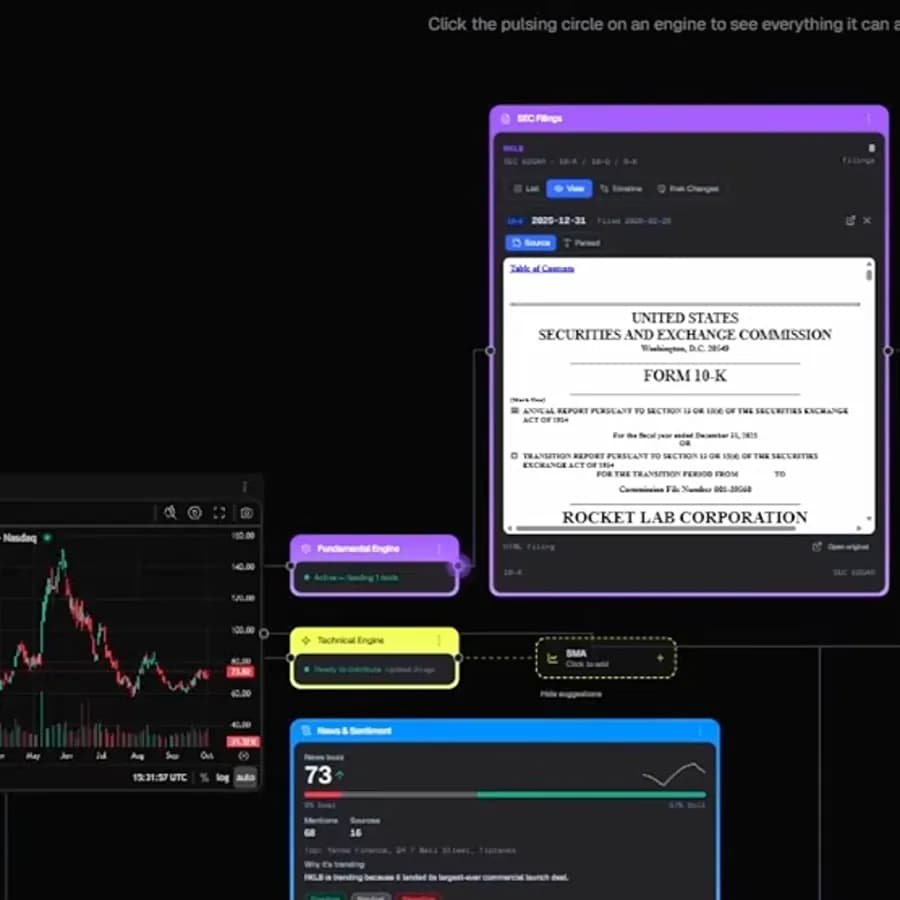
An illustrative Tesla research canvas lifts out of a laptop and expands. Company Search connects to a chart, a Fundamental Engine with financial performance and statements, and a Technical Engine with RSI. Bob and Charlie can see the whole canvas and answer questions about it. Continuing to scroll zooms out to reveal valuation, growth, profitability, moving averages, peer comparisons and market context. All data is illustrative.
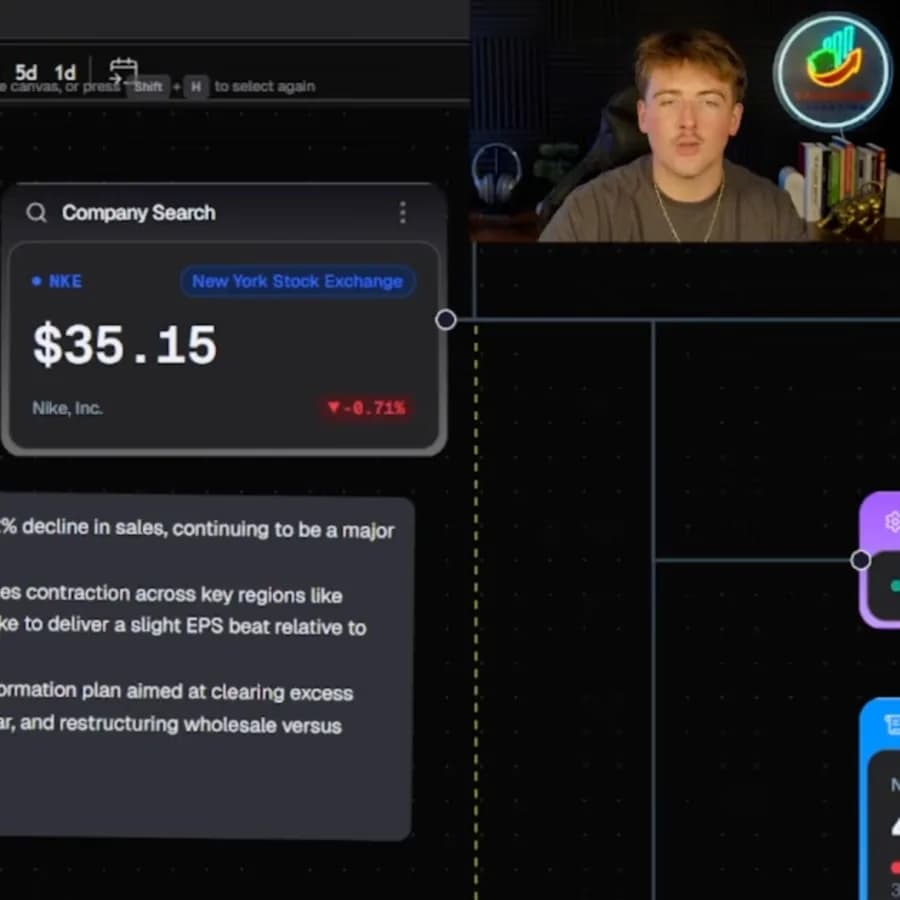
Find a company. Add a chart. Connect the news.
Your next idea starts with /.
Open Fynca Command with /. This scroll-controlled illustration searches for Microsoft, adds its company card, then connects an Advanced Chart and a News & Sentiment node. No live data or real canvas actions are used.
Four AI specialists, each with a different lens on your research. Bring their perspectives to your canvas.
A second pair of eyes. The numbers, the price action, the conversation, the bigger picture. Choose the expertise your research needs, or create an analyst with your own perspective.
Meet your analysts

AI · Fundamentals
Numbers before narratives.
Looks past the headline figures, into cash flow, filings and what the business actually earns.
Statements · Filings · Earnings calls

AI · Technicals
Every setup needs a line.
Reads the trend, watches the indicators and asks what would change the picture.
Price · Indicators · Market regimes

AI · News & sentiment
Headlines don’t tell it all.
Follows the news and the mood around it. Separates a shift in tone from a change in the story.
News flow · Social sentiment

AI · Macro
Watch the wider current.
Zooms out to rates, currencies and sector shifts. Connects your research to the bigger picture.
Rates · Currencies · Sector rotation
Research together in real time. Arrange the canvas, write notes, and ask the AI, all in one shared space.

An open canvas. Sixty-four node types. Go from the big picture to the original filing without losing your train of thought.
Node families: Company Search, Advanced Chart, Fundamental Engine with twenty-one sub-nodes, Technical Engine with seven indicators, market maps, screener, news and sentiment, prediction markets, and Chatsight.
About Fynca
We were running our own research across eleven browser tabs, two terminals, and a private Discord - and it was driving us insane. Three time zones, one obsession, zero patience for clutter. So we're building the screen we always wished existed.
Bob & Charlie · Chief Morale OfficersFAQ
Missing one? Ask in Discord or WhatsApp - the team answers directly.
Most retail investors research across a brokerage app, a charting site, filings, news, community posts, and an AI chat. Fynca puts that work on one visual canvas: every chart, filing, note, and AI prompt becomes a node you can connect and come back to.
No. Robinhood is where you place trades. Fynca is where you research and pressure-test an idea before you decide what to do elsewhere. Fynca does not execute trades, hold your money, or connect to your brokerage account.
Chatsight is the AI built into your canvas. It works from the material you connect to it - filings, charts, and notes. Ask what changed between two quarterly reports, what a chart is showing, or which risks a 10-K flags. Its answers are AI-generated, so check anything important against the primary source.
Yes. Ask Chatsight plain-English questions like "what does P/E mean?" or "summarize the key risks in this 10-K" and it explains using the filings and charts on your board. The Free plan lets you learn at your own pace, with no credit card needed.
From licensed market-data providers, exchanges, and public sources such as SEC EDGAR filings. The data is licensed for use inside Fynca, so the providers' terms apply.
Every plan charts 1-minute intraday candles that update during market hours. Prices in Fynca are indicative research data, not execution prices: some values may be delayed or derived, and providers differ on venues, timestamps, and split or dividend adjustments. So a price can differ slightly from what your broker shows.
Fynca runs in your web browser, with nothing to install. Desktop app for macOS (Apple silicon and Intel); Windows is coming soon.
Still curious? support@fynca.io - we read every message.
Research tool. Not investment advice. Trading involves risk of loss. 1-minute intraday candles are included on every plan. Market data timing varies by source and display; prices may be delayed, derived, or estimated and are not for execution.